The e-commerce business is on the boom, with new e-commerce websites launching every day. If you want to grow in this competitive market, keeping an eye on global eCommerce statistics becomes imperative.
The knowledge of trending eCommerce statistics will be helpful in strategizing your eCommerce business, and you’ll be able to remain at the top of your game. On that note, in this article, we have compiled 70+ Useful Ecommerce Statistics for 2022 to help you understand where the industry is going and how you can leverage it to the best of your advantage.
70+ Useful ecommerce Statistics for 2022
The eCommerce industry is constantly growing, and so is the competition in it. People owning online businesses have to remain on their toes to stand out amidst the competition and make their business scale. Knowledge of the recent market trends and statistics becomes essential in such a scenario.
So, to make things easier for you, here, in this article, we have compiled some of the most useful eCommerce trend statistics to help you keep up with the market competition and take your business to the next level.
General eCommerce Statistics
People are increasingly inclined towards online shopping. The names of applications like Amazon, Flipkart, etc., are always on our minds when it comes to shopping. Looking at this growing and increasing trend in purchasing products from eCommerce stores, it’s believed that the eCommerce market is going to scoop more than 95% of overall market purchases by 2040. (Nasdaq)
So, there’s a huge scope for the e-commerce industry and businesses. With that said, here are some general eCommerce statistics that you must know to keep up with the market growth and other trends.
- The e-commerce market has already become a trillion-dollar industry, and it’s projected that by 2025 the revenue will shoot to $4.2 trillion, which is almost a 50% hike from the $2.86 trillion revenue that it already made in 2020. (Statista)
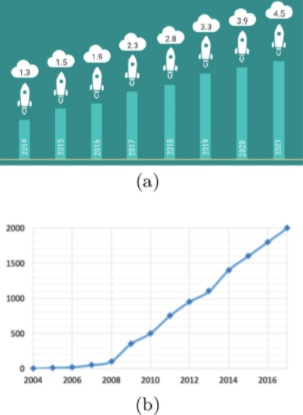
Source: ResearchGate
- The internet is full of e-commerce stores. As of now, it’s estimated that there are between 12 to 24 million online stores available, and this number is constantly growing. (Digital In The Round)
- Of all the online stores that you can find on the internet, the one with the most prestigious and popular name is Amazon. It is the most visited online store and accounts for 44% of the eCommerce sales in the US alone. (CNBC)
- Moreover, millennials and Gen X, who are, by far, the largest online buyers, with 67% millennials and 56% Gen X preferring eCommerce stores for their major purchases (Statista), also keep Amazon as their first choice. In fact, a good 59% of millennials will first look through Amazon when shopping online as opposed to any other site. (Inviqa)
- China is, by far, the fastest growing economy in the eCommerce market, with more eCommerce sales valuing up to $2.1trillion booked in the year 2021 alone. (Global Data)
- In addition to the eCommerce industry, the blogging industry is also growing significantly, and both these industries often work in tandem. This is evident from the fact that blogs inspire almost 61% of online shoppers to make a purchase by offering recommendations and reviews. (Content Marketing Institute)
- Overseas sellers are able to book more online sales given the fact that 54% of shoppers prefer them for their purchases. (Invespcro)
- The pandemic has been among the biggest causes of the growth of the eCommerce industry in the past 2years. Statistics reveal that the eCommerce sales in 2020 increased by 27.6%, which was much beyond what was projected for the year. (eMarketer)
- With the shift to online platforms, businesses are on a constant move to make their operations entirely virtual. 69% of the businesses that are moving to online platforms with their e-commerce stores mention that they are planning to stop printing brochures and other product catalogs altogether to stick to operating only on the digital platforms. (OptinMonster)
eCommerce Statistics on Latest Industry Trends
When you want to keep growing in a market as competitive as the eCommerce industry, you need to keep a tab on the latest trends in the industry. With the proper knowledge of what’s really going on in the eCommerce industry, it becomes easier for you to plan your strategies while getting a competitive edge in the market. So, here are of of the most useful eCommerce trend statistics for your reference-
- The pandemic has been the major driver in the growth and success of the eCommerce industry. While the trend towards online shopping peaked during the pandemic, people also changed their shopping styles and trend. 75% of people have changed the way they shop online and tend to go on with the same trend even after the pandemic. (McKinsey)
- Mobile phones are the most accessible means of technology we have, and that’s what people prefer for online shopping too. M-commerce is most trending in the space, with 79% of the audiences inclined to place their orders using smartphones. (Simicart)
- The eCommerce market is also expanding rapidly in the B2B sphere. The market has been steadily growing at an annual rate of 18.7%. (Grand View Research)
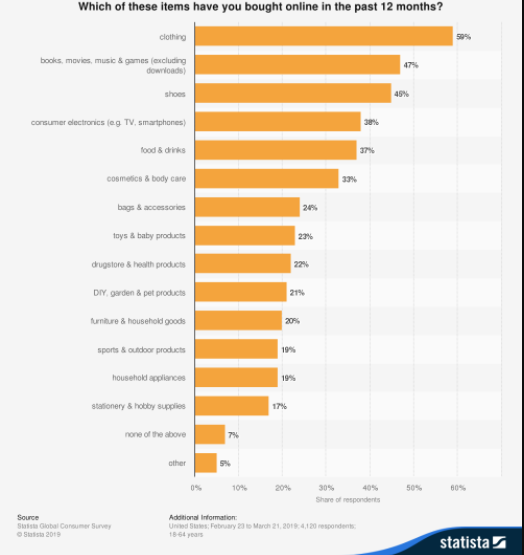
- Apparels and clothing are the most trending in eCommerce purchases, with 46% of the retail eCommerce sales dedicated to clothes. (Digital Commerce)
- The trend is towards the green initiative, and consumers have become conscious about the environment and believe that companies must do the same. More than 70% of the customers seek to purchase from companies that are environmentally responsible. (Social Media Today)
Moreover, consumers look for recyclable packaging, and three-fourths of the environmentally-conscious consumers are of the opinion that they would rather have companies use recyclable packaging with minimal packaging material. (Nosto) - Artificial Intelligence and Automation are in trend, and companies are highly inclined to use the same. Statistics reveal that 78% of companies have already implemented AI in their stores, and 80% of the companies that have not implemented the same are planning to do the same soon. (Oracle)
- People are more inclined towards shopping from social media channels and from brands that they can reach out to using social platforms. In fact, brands that have social media presence are able to make 32% more sales. (BigCommerce)
Platform-Based eCommerce Statistics
You can use multiple platforms for creating your eCommerce stores. However, you need to be on the right platform that suits your specific business requirements at best to help you leverage higher benefits from your eCommerce stores. The different eCommerce platform statistics can help you have a better idea about the platforms that you must use for your store.
- The most popular eCommerce development platform is Shopify, powering more than a million eCommerce websites, which makes up for almost 27% of the total market share. (Tooltester)
- Amazon is the leader in the online marketplace, and most big sites, such as Amazon, eBay, Alibaba, etc., make up for almost two-thirds of the online sales. (Intelligent Reach)
- For your eCommerce platforms to make big in the industry, they need to take care of the security as well. Almost 85% of the customers refrain from making a purchase from a platform that’s not secure. (Global Sign)
- eBay has the largest market share in handling online exports. 96% of the eCommerce exports are made from this platform alone. (eBay)
- WooCommerce by WordPress stands next in the race for the most competitive and popular eCommerce platforms, with more than 5million downloads in total.
Additionally, Salesforce, Wix, and BigCommerce have the same standing in the market, with just as much share held by WooCommerce, i.e., 12%. (Trust Radius) - ECommerce software are equally essential for eCommerce growth. One of the best software to choose is Squarespace which currently covers 9% of the market share. (Trust Radius)
Conversion and Sales Related eCommerce Statistics
Conversions are another essential aspect of achieving eCommerce success. It’s essential for your business to make the desired conversions to ensure that you’re gaining visitors and customers and ultimately selling your online products and services. A look into the most important and useful eCommerce conversion statistics can be helpful in understanding how you can drive conversions to your own website.
- While the eCommerce business is booming, getting conversions on your stores is extremely difficult, given that the average conversion rate for eCommerce stores globally is only 4.63%. (Invespcro)
- Testing and analysis is important aspect of driving conversions. One of the major conversion strategies that almost 100% of the marketers and eCommerce experts rely on is A/B testing. Almost 79% of the companies run at least two A/B tests every month. (Invespcro)
- The checkout pages are essential to driving conversions. You can increase the conversion rate up to 35% by optimizing the checkout page design. (Sleeknote)
- Customer service is the major key to driving conversions. When you offer good experiences to your customers, they actively interact with your store. However, if the stores are bad with their services, almost 40% of the customers will stop interacting with the store and find a better store for their online purchases. (Statista)
- The shipping options are also essential for driving conversions for your store. In fact, free shipping options can increase conversions by as much as 50%. (Acowebs)
- Moreover, 85% of the consumers and customers prefer to get free shipping options in place of faster shipping. (Deloitte)
However, there are also almost 28% of customers who remain willing to pay more if they get faster shipping. (Deloitte)
So, the conversion rates depending on shipping options are very varied and depend a lot on consumer behavior.
eCommerce Statistics Related to Mobile Commerce
Mobile is the most accessible device we have in our hands. People are inclined to do most of their online business using mobile phones. It’s for this reason that the trend is towards mobile commerce. So having a look at the eCommerce mobile statistics is also essential. So, let’s have a look at the same.
- Most consumers prefer their mobile phones for their online shopping purposes. Given the inclination towards the use of mobile for online shopping, it’s no wonder that the mCommerce market is currently more than a $3 trillion industry. (Cell Phone Deal)
- Almost half of the online sales are made through mobile phones, making mCommerce own 50% of the share of the eCommerce industry. (Emizen Tech)
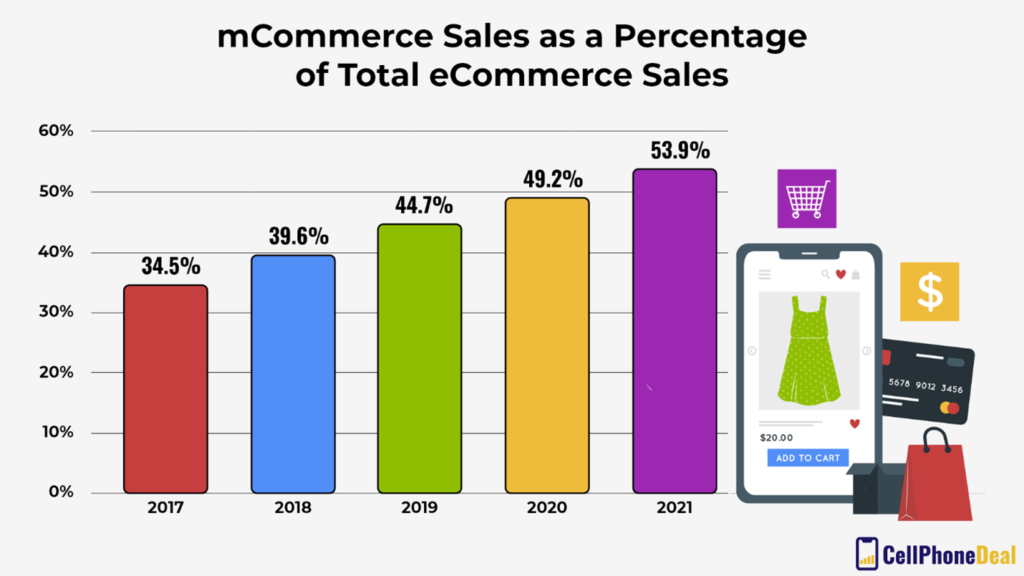
Source: Cell Phone Deal
- Mobile commerce is prevalent during physical shopping from stores too. Almost 80% of the customers check the deals and prices on their mobile phones before finally making a purchase from a physical store. (Outer Box Design)
- Mobile applications are more prevalent than mobile websites when it comes to mCommerce, with almost 21% conversions made from mobile apps as opposed to only 6% conversions made using mobile websites. (Martech)
- Negative experiences on a mobile application or website tarnish the image of your mCommerce store, turning off almost 62% of customers engaging with your store. (Think With Google)
- Most shoppers check out and research product information before finally making a purchase, and they mostly conduct this research through their mobile phones. Moreover, 32% of the buyers change their buying decision after their research of the product on the mCommerce store. (Invespcro)
- The eCommerce stores that are able to make their sales through paid search ads get most of their clicks from mobile phones. Statistically, these search clicks from mobile are 68% of the total clicks. (Lets Link)
ecommerce Statistics based on Consumer Behavior and Preferences
The eCommerce sales and conversions are also driven by consumer behavior and preferences as regards online shopping. It’s only when you study consumer behavior and know it well that you can grow your eCommerce business. All these eCommerce consumer statistics will help grow your business big time by attracting and converting more and more customers to your store.
- Research is an important element for consumers when making any online purchase. Almost 81% of the buyers base their buying decision on their research of a product. (Adweek)
- Consumers are more inclined towards sustainable shopping. 52% of the customers prefer purchasing eco-friendly products. However, while consumers are inclined to more sustainable products, the higher cost of such products also makes as much as 60% of the consumers unable to buy them. (Social Media Today)
- People are shopping everywhere and in any state. Most online purchases are made in bed. Statistics reveal that 43% of the customers place an order while in their bed. (Business Wire)
- Booze and alcohol are a great thing for eCommerce stores, given that sales rise when people are drunk. 10% of people make purchases in a drunken state, while 43% of such people say that they really regret their decision. 21% of people also state that they didn’t really want or need the product they bought when drunk. (BigCommerce)
- Impulsive purchases have taken over the online market big time since the pandemic. Given that people are more on their mobile phones, almost 61% of them indulge more in unplanned and in-the-moment purchases. (Magnify Money)
- While online shopping trends are growing by the day, people are still inclined to try the products before finally reaching a buying decision. On that note, virtual trials have become a thing, and almost 35% of consumers are inclined to make a positive buying decision when they’re provided with this option. (1Digital Agency)
- People talk more about their bad experiences rather than the good ones, and this is especially true when it comes to online shopping. Statistics reveal that 55% of people share their bad and poor shopping experiences with their friends, family, and colleagues. (Transaction Agency)
- People are highly inclined towards reading customer reviews when making purchases. Generally, people will read at least six detailed reviews of a particular product before finally buying it. (Statista)
- Most people prefer making their purchases using credit cards and digital modes of payment, with digital payments accounting for 25% of sales and credit cards for 29% of sales. (Rapyd)
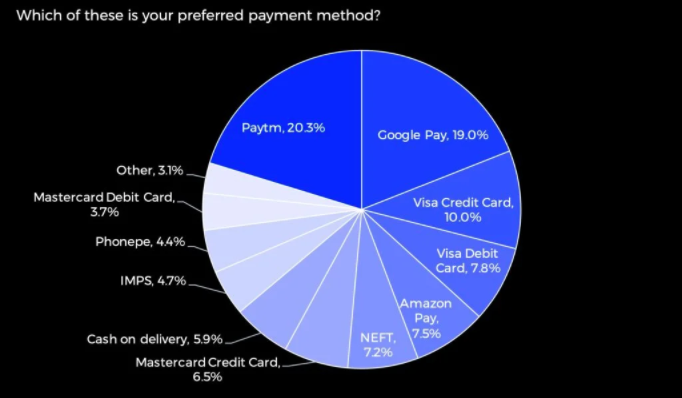
Source: Rapyd
10. Language also influences buyer behaviors. 65% of customers prefer shopping from a website where they can consume content in their preferred and regional languages. (Shopify)
Social Media Channels and Platforms eCommerce Statistics
Social media has the attention of everyone. People begin their day using social media and end it with social media too. Moreover, there are many eCommerce stores that are growing and expanding their business by establishing online marketplace on social media channels such as Instagram and Facebook.
So, you need to keep up with the trends in social media by checking out important social media eCommerce statistics.
- Social Media Commerce is relatively more popular than you may think. More than half of the total customers in the market, precisely 55%, are aware that they can do online shopping using social media channels. Moreover, 35% of the customers are extremely likely to make a purchase from a social commerce website. (Social Media Today)
- Social media presence offers a significant boost in eCommerce sales. Almost 80% of customers remain willing to buy from a brand or website that has a good social media presence and identity. (Sprout Social)
- Influencer marketing boosts the social commerce sales for a brand helping up to 92% of businesses to generate more revenue. (Convince and Convert)
- People are very much inclined to follow their favorite brands on social media, and 56% of them do so for the mere purpose of staying updated about the brand’s product releases and launches. Moreover, social networks influence the buying decisions of as many as 78% of the buyers. (Awario)
- Facebook is the most thriving social media platform when it comes to social commerce, with almost 85% of the social media sales coming from Facebook alone. (Shopify)
- Advertisements have a great impact on customer behavior, especially when it comes to social media commerce. Instagram advertisements play a huge role in increasing website traffic, with three-fourths of the audiences checking out the official websites after looking at an Instagram ad of a brand. (Locowise)
eCommerce Statistics Based on Use of Emails and Email Marketing
Emails are still the most preferred means of corporate and business communication, and they have become important for eCommerce businesses as they have to rely on emails to send updates about an order, payment, shipping, etc. Moreover, emails are also a great way for sending newsletters and running marketing campaigns to get more customers.
Given the importance of emails, it’s imperative that we have a look at some of the most trending email eCommerce statistics.
- While social media is prevalent and people are okay receiving direct messages for their order details and other product news and launches, a good 47% of customers still prefer email communication. (Retail Dive)
- Email Marketing has amazing scope in bringing more traffic to your websites and increasing your sales. In fact, email marketing campaigns can grow the traffic on your website by 20%. (Wolfgang Digitals)
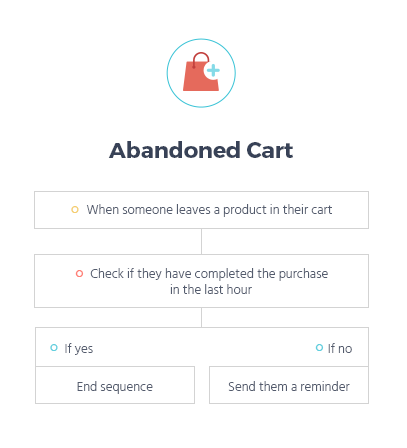
Additionally, 60% of the customer purchases are inspired by an email they received promoting the product. (OptinMonster) - Follow-up emails that you send for an abandoned cart have a great open rate. Almost half of the customers who abandoned their shopping cart will open your abandoned cart emails. (Moosend)
Source: Moosend
4. Emails provide the highest returns on investment to marketers with almost 40x open rates as compared with social media channels. Moreover, personalization helps increase the open rates by 26%, and you can increase your eCommerce revenue by almost 800% just by running segmented email marketing campaigns to deliver more value to the subscribers. (Campaign Monitor)
eCommerce Statistics on the Market Growth Patterns
How the eCommerce market is growing is also essential to understand in order to leverage the best out of your eCommerce business. By keeping up with the growth patterns and trends in the market, you’ll be able to plan for the future. So, here are some of the most useful eCommerce growth statistics for your business.
- The clothing and accessories sections have seen the most growth in online shopping. The online purchases in these departments have increased by a whopping 19%. (Statista)
Source: BigCommerce
- Insider Intelligence has projected that online sales in the US will increase by 16% and become a trillion-dollar industry by the end of 2022. (Insider Intelligence)
- Worldwide eCommerce sales are constantly growing, and they are expected to be 22% of all retail sales made globally by the end of 2024. (Pop Up Smart)
- The Indian eCommerce market is growing at a phenomenal pace, and the industry, which hasn’t crossed $50 billion in revenue till now, is expected to grow and reach a revenue of more than 100 billion dollars by 2025. (Shopify)
- Asia is the continent experiencing the fastest growth in the eCommerce industry, with the Chinese market making the most through eCommerce sales. The sales are expected to grow by 51% by 2025 in the Asian continent alone. (Oberlo)
- The pandemic led to an increase in online shopping for groceries and medicines as well, with a 10% and 16% rise in both, respectively. (Statista, Statista)
eCommerce Statistics on Shopping Cart Behavior and Abandonment
Source: eCommerce Guide
Shopping carts are the most important aspects of any eCommerce store. All the conversions take place in this area. So, it’s essential that you keep up with shopping cart eCommerce statistics to make sure that you drive the most conversions from your carts.
- The shopping cart abandonment rate is fairly high, with almost 60.7% of the customers leaving the cart without placing the final order at the checkout. (Fresh Relevance)
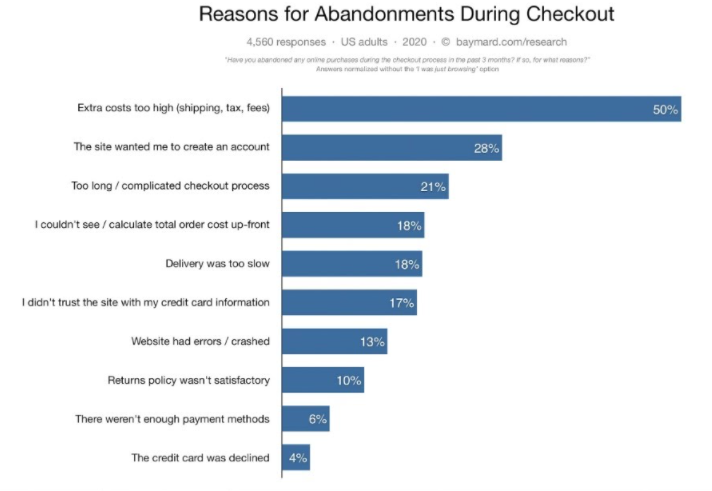
- Almost half of the customers abandon their cart due to the extra costs that they need to incur during the checkout. Other reasons include slow delivery (19%), complicated checkout process (18%), unsatisfactory return policy (11%), lack of payment options (7%), and there are more reasons too. (Baymard)
- You can get back the customers abandoning your carts immediately by placing exit-intent popups on your site. Such pop-ups are known to recover almost 53% of the abandoning customers. (OptinMonster)
- Half of the people who open the cart abandonment emails complete their purchases. (Moosend)
- Among all the devices that people use for online shopping, most carts (78%) are abandoned when shopping using mobile phones. This is also possible because people use one device to research and a completely different device to complete their transactions. (OptinMonster)
- Clothing and Apparels experience the highest cart abandonment rates that range as much as 40%. (OptinMonster)
- 60% of the people abandon carts due to issues with shipping and delivery. (Moosend)
That’s All On eCommerce Statistics! Let’s Have a See Through the Future Too!
So, these were all the essential and useful eCommerce statistics that you needed to know. eCommerce business is on the boom, and all the eCommerce business statistics that we have seen in this article put light on the fact that the industry is going to keep growing and constantly expanding in the years to come.
So, clearly, the future is bright for all the eCommerce entrepreneurs and marketers out there, also giving the retail business reasons to shift to online business platforms.