With the advent of the modern age internet, the use of social media usage statistics has emerged as the driving force changing not only the way we maintain our personal engagements but the business ones too. Could you imagine a simple message through your mobile device could outperform a conventional classified for the roommate search of yours, in the 2000s?
From creating mobile-run new-age businesses to forcing the traditional brick and mortar businesses to reassess their very business models, the use and relevance of social media marketing statistics have come a long way.
Here are 60+ social media statistics worldwide that remind us how integrated our daily lives and profession have become to the social media juggernaut:
Popular social network statistics
- According to Alexa, Facebook, the 7th most popular website across the globe, has an estimated daily time per visitor of 17 minutes and 44 seconds. Source: Influencermarketinghub
- On average, 300 hours of video are uploaded every minute on YouTube. Source: Dustin stout
- Most Instagram users as per teenage use of social media statistics are between 18 to 29 years of age with 32% of Instagram users being college students. Source: Dustin stout
Source – Hootsuite
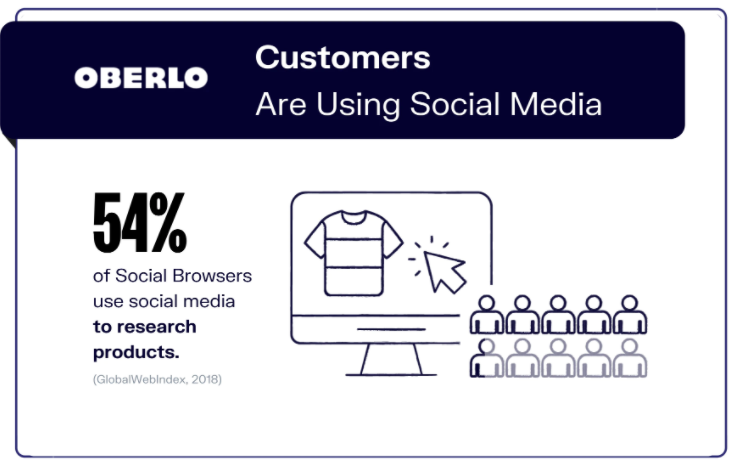
Source – Oberlo
- Facebook remains the most widely used social media platform, roughly two-thirds of U.S. adults. Source: Oberlo
- The average social media user engages with an average of 6.6 various social media platforms. Source: backlinko
- The second most popular social media platform is Youtube with 2.29 billion registered users. Source: Dreamgrow
- In the US, 54% of social media users are female, while the remaining 46% are male, compared with a global average of 45.6% for females, and 54.4% for males. Source: backlinko
- The latest social media statistics show that there are 3.78 billion social media users worldwide in 2021. Source: Oberlo
Facebook Statistics
- The best times to post are Tuesday, Wednesday, and Friday from 9:00 a.m. – 1:00 p.m. Source: SproutSocial
- Social media marketing statistics also reveal that the worst day to post is Saturday. Source: SproutSocial
- In 2020, Facebook had an operating profit of $32.6 billion. Source: Businessofapps
- 57% of Facebook’s audience is male. Source: Hootsuite
- 63% of the U.S. population over age 12 uses Facebook. Source: Hootsuite
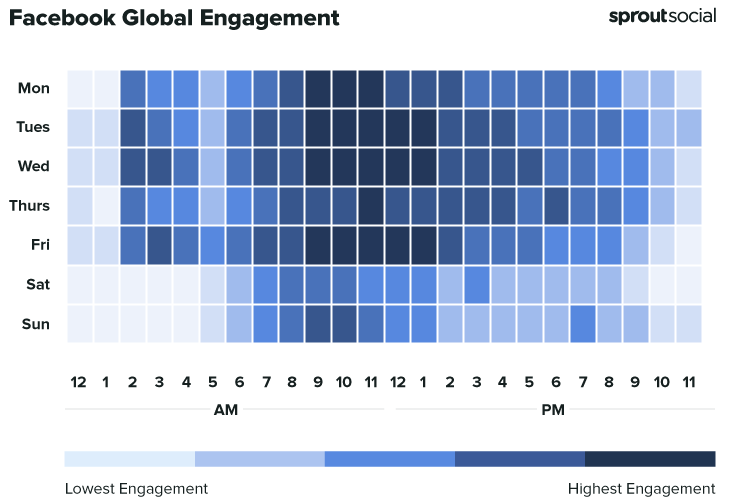
Source – SproutSocial
- Facebook has admitted to deleting 1.3 billion fake Facebook accounts. Source: Websiterating
- Countries with over 100 million Facebook users include India (320), the USA (190), Indonesia (140), and Brazil (130). Source: Omnicore
- Facebook users generate 4 million likes every minute. Source: Websiterating
- Around seven-in-ten U.S. adults (69%) use Facebook. Source: Omnicore
- Every day, 35 million people update their statuses on Facebook. Source: Websiterating
Twitter Statistics
- Twitter reached 211 million daily active users in Q3 2021. Source: Statista
- The best times to post on Twitter are Wednesday and Friday at 9 AM, and Saturday has the least engagement. Source: Sprout Social
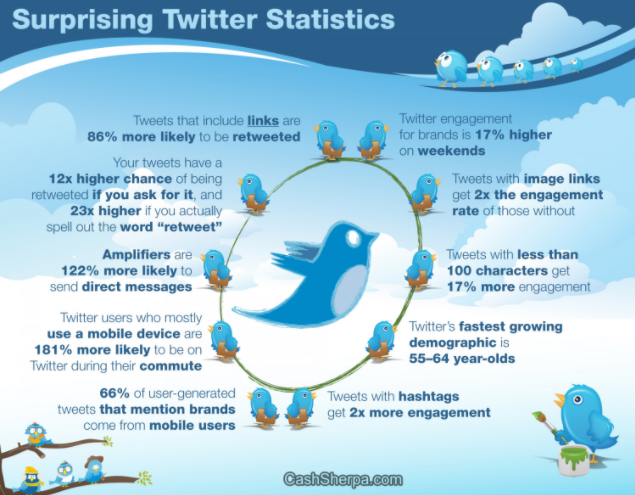
Source – Netdna
- Tweets with hashtags get 100% more engagement. Source: Twitter
- Socially responsible ads on twitter perform 12% better than standard ads. Source: Magna
- 26% of US users check their Twitter account several times a day. Source: Statusbrew
- 83% of the world’s leaders are on Twitter. Source: Statusbrew
- According to 2021 statistics, one in five people in the U.S. uses Twitter. Source: Omnicoreagency
- These latest figures indicate that roughly 5.5% of all the people on Earth use Twitter today. Source: Datareportal
Linkedin Statistics
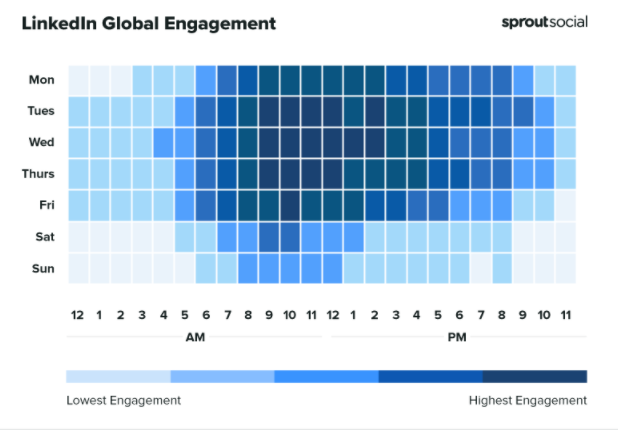
Source – SproutSocial
- The best days are Tuesday, Wednesday, Thursday, and Worst day is Sunday. Source: SproutSocial
- The Best times to post are Tuesday and Thursday 9 a.m.–noon, Wednesday 9 a.m.–2 p.m. Source: Sprout Social
- As per social media business statistics by Omnicore Agency, 48.5% of US LinkedIn users are Monthly Active Users. Source: Omnicoreagency
- LinkedIn’s advertising audience reach has grown by 8.8% over the past 12 months. Source: Statusbrew
- Females account for 43.1% of the total LinkedIn users, while 56.9% of LinkedIn users are male. Source: Omnicoreagency
- 51% of US College Graduates use LinkedIn. Source: Omnicoreagency
- LinkedIn is more popular with men, who comprise 57% of its user base. Source: Kinsta
- LinkedIn generated $8 billion in revenue in 2020, an increase of 19 percent year-on-year. Source: Businessofapps
- LinkedIn gains a new member every 2 seconds. Source: Techjury
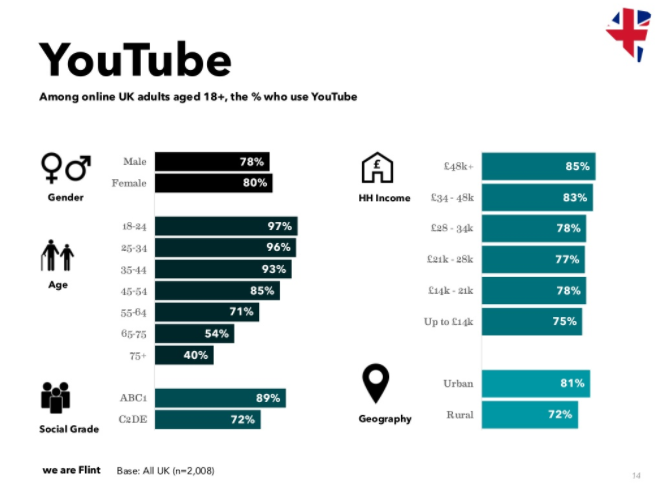
Youtube Statistics
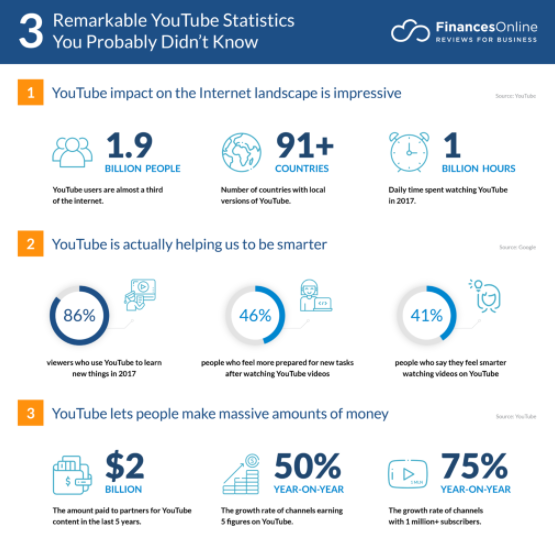
Source – Financesonline
- 1 billion hours of YouTube videos are watched daily. Source: YouTube Press
- YouTube ranks second in the most visited sites organically in the US and first when the same is charted globally. Source: Ahrefs
- 90% of digital consumers in the US use YouTube – making it the most popular choice for watching online videos. Source: Oberlo
- Only 9% of small businesses have their own Youtube channel. Source: Brandwatch
- As of the last quarter, 77% of the US internet users in the age 15-35 use YouTube. Source: Statista
- The online video platform’s audience will amount to 210 million viewers in 2022, up from 192 million in 2018. Source: Statista
- YouTube has over 2 billion monthly active users. Source: SproutSocial
- According to 88% of marketers, video marketing provides them with positive ROI. Source: Smart Insights
- 70% of what people watch on YouTube is recommended by its algorithm. Source: Invideo
- 81% of adults in the US use YouTube. Source: Serpwatch
- Total Youtube revenue in 2020 was around $19.7 billion. Source: Omnicoreagency
Source: Businessofapps
Instagram Statistics
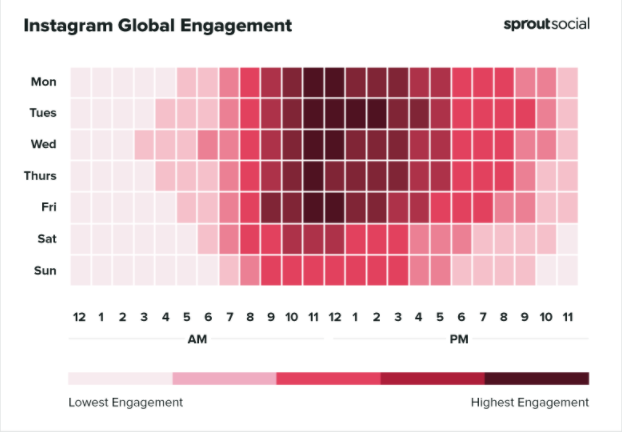
Source – SproutSocial
- The best time to post on Instagram is Monday to Friday at 11:00 a.m. Source: SproutSocial
- The best day to post is Tuesday and Worst day to post is Saturday. Source: SproutSocial
- 73% of marketers favor Instagram for influencer marketing. Source: Statusbrew
- The fashion sector has the highest engagement rates and post frequency on Instagram. Source: Statusbrew
- 80% of Instagrammers are Partaking with Companies. Source: Technnaa
- Instagram is the most followed brand with 424 million users, followed by National Geographic with 186 million. Source: Businessofapps
- 84% of US teenagers use Instagram, with 25% saying it’s their favorite social media platform. Source: Marketing Charts
- It took 8 months for stories on Instagram to overtook Snapchat’s 150 million Daily Active Users. Currently reaching half a billion people every day. Source: Demandsage
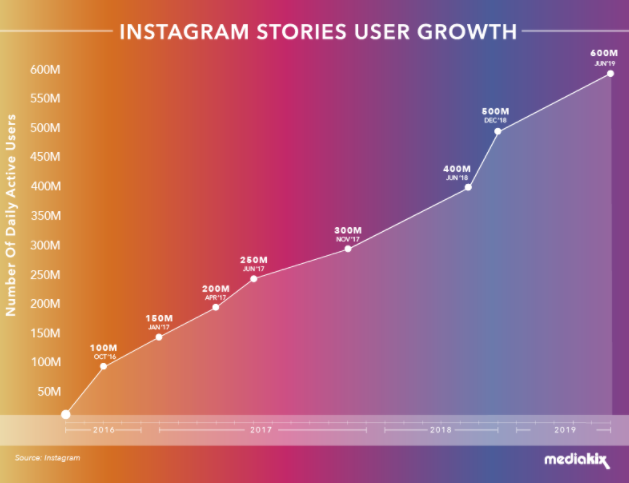
Source: Mediakix
Social Media Statistics for Business
- Frequency of social media posting by business people:
Daily: 52%, Once In A Week: 80%, and Monthly: 94%. Only 6% of businesses are not posting even on a monthly basis. Source: Elluminati - 54% of People on Social Media Use It To Research Products. Source: Legiit
- Around 90% of business marketers believe that their business has experienced good exposure because of the social media campaigns. Source: Elluminati
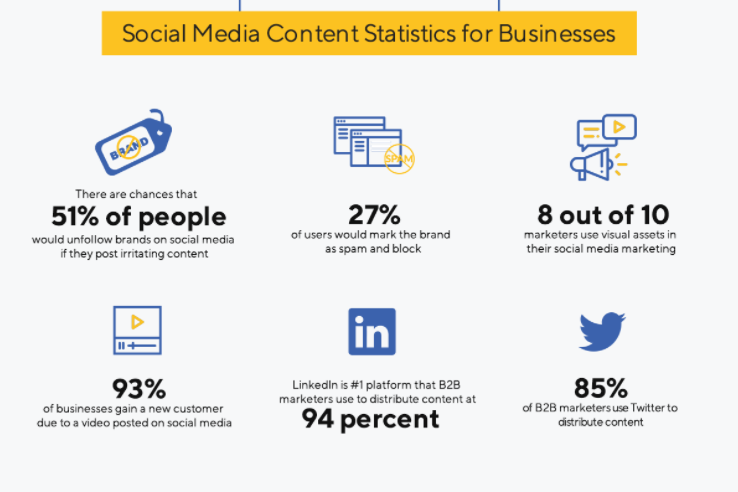
Source: Statusbrew
- 71% of small-to-mid-sized businesses use social media to market themselves, and of those who do so, 52% post at least daily. Source: Renolon
- Social media helped increase business website traffic by 75%. Source: Renolon
- 2.93% of all marketers think that more exposure for their business is the main benefit of using social media. Source: Renolon
- According to Statista, in 2020, just short of 92% of U.S. companies with at least 100 employees used some form of social media marketing. Source: Legiit
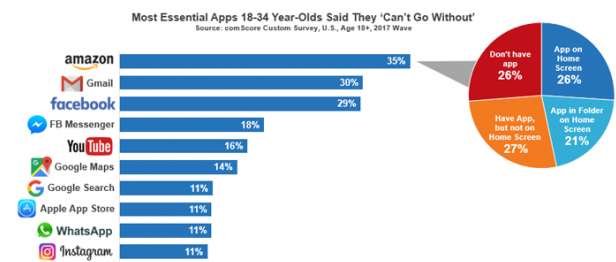
- Adults aged 18 to 34 are most likely to follow a brand on social media, with 95% of them doing so. Source: Asset Digitalcom
- 1 in 3 Social Media Users says That One of the Main Reasons They Use the Platform Is to Follow a Brand or Find Products to Buy. Source: Supplygem
Social Media Usage Statistics as the data bank driving business strategies today
With businesses facing cut-throat competition to connect with the customer rather than conventional selling, the use of refined data to understand the actionable insights becomes imperative. A consistent eye on what’s trending on social media is a time-tested way to synchronize one’s efforts with mainstream emotion in the VUCA world.